MARKET INTERNALS INDICATOR
US MSI helps you instantly read overall market sentiment and momentum—so your trades follow the true direction of strength.
Tracking multiple indices and internals can be overwhelming—especially mid-trade. Conflicting signals add confusion, and by the time you make sense of it, the opportunity is gone.
US Market Strength Index (US MSI) simplifies this with one clear visual panel that colors itself red or green based on live market strength across major U.S. futures indices.
It calculates a real-time, weighted momentum score from Dow, S&P 500, Nasdaq, and more—and tells you when bulls or bears are in control.
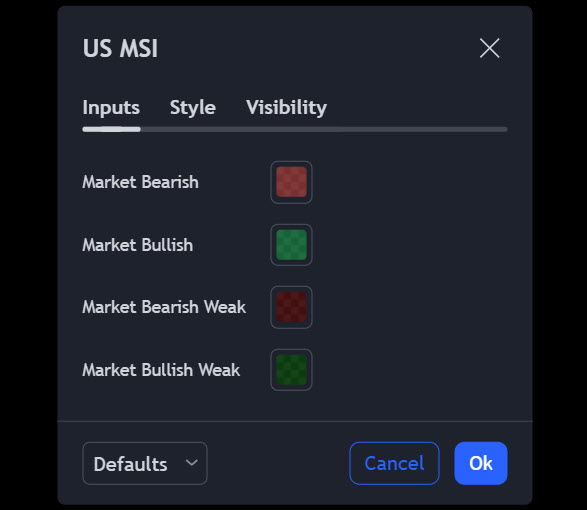
✅ Green Panel = Majority Bullish
✅ Red Panel = Majority Bearish
✅ Brighter = Strong Momentum
✅ Darker = Weak Momentum
Stay aligned with big money. Trade with confidence.
Start using US MSI on your favorite trading platform—no steep learning curve.
🧠 Built on Futures Market Internals
US MSI uses futures contracts as its core data—because they’re traded nearly 23 hours a day by professionals and reflect true market sentiment.
🔴🟢 Momentum Color Shading
Panel turns bright green or red when trend momentum strengthens, and darker shades when momentum fades. You’ll feel the shift—before it shows on price charts.
⚖️ Weighted Scoring Across Indexes
US MSI combines directional strength and momentum across major U.S. indices. Each contract contributes to a total score that updates in real time, keeping you on the right side of sentiment.
SEE Example: TSLA 15 min Candle chart with US MSI Indicator

🎯 Want to Try US MSI First?
✅ Built-In Trading Guidance
US MSI helps you:
🧭 Stay Aligned with Market Sentiment: Avoid trading against the tide
🟢 Time Long Trades When Strength is Green
🔴 Time Short Trades When Strength is Red
💡 Know When to Stay Flat: Dark shades = caution zone
📉 Spot Weakness in Bullish Moves (or vice versa)
✅ Real Trading Logic Backed by Market Behavior
When markets are broadly bullish (bright green):
Sellers raise their prices
Buyers jump in with confidence
Shorts stay out—or get squeezed
Momentum fuels more buying
When markets are broadly bearish (bright red):
Buyers pull back
Sellers dominate with lower offers
Short setups get stronger
Weak longs get stopped out
US MSI helps you ride these dynamics instead of trading blindly against them.
✅ Works with Any Chart, Any Trade Plan
US MSI is the perfect overlay for any equity, futures, or options trader who wants to:
🔹 Filter for high-probability trades
🔹 Avoid fighting trend days
🔹 Add market confirmation to every entry
🔹 Build confidence with directional bias
Simple Set-Up:
Add the Indicator to the chart
You can change the default colors if you wish
Important Notes: Since this script uses futures contracts, you must have a futures data subscription for real-time data. At the minimum, you need CME/ CBOE exchange data.
Build Your Edge with Automated Price & Volume Analysis
Watch this short demo to see how TrapZone Pro & UMVD simplify real-time market reading—giving you fast, focused technical insight when it matters most.
Click your platform below. Cancel in 3 days, pay nothing.